Pyramids Can Take Many Forms: More on Why Africa is Poor


My Wabash economics prof Ben Rogge used to say that rulers have always liked to spend the people’s money to build pyramids intended to proclaim the glory of the ruler.  But in modern times the rulers have to be a tad more subtle than the Egyptians, so, for instance, in Brazil they build Brazilia, instead of actual pyramids. 

And according to the story below, summarized from the May 2007 IEEE Spectrum, in Africa, they build large dams.


Small dams could help deliver electricity to much of Africa’s population, but since they lack the prestige of larger-scale projects, few of them get built.

. . .

In Uganda, which has plenty of rivers and streams to supply power, Mr. Zachary describes how a small water-power generator, supplied by a small nearby dam, delivers 60 kilowatts of energy to a nearby hospital. The generator would barely be enough to run a single magnetic-resonance imaging machine, a staple in Western hospitals. But it does provide enough power to light the hospital and keep basic equipment running for the 100 nurses and doctors who work there. The entire generation system cost $15,000 to build.

Still, Africa’s leaders are unlikely to abandon their preference for big public works, says Mr. Zachary, since they create thousands of construction jobs and reinforce the political might of the central government. 


For the full summary, see: 

"Informed Reader; ENERGY; Small Dams Might Help to Electrify Africa."  The Wall Street Journal (Tues., May 8, 2007):  B10. 

(Note:  ellipsis added; the original article in IEEE Spectrum is by G. Pascal Zachary.)


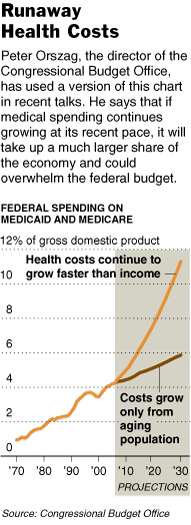
Doctor and Patient Incentives, and Lack of Competition, Fuel High Health Costs


HealthCostsGraphCBO.gif  Source of graphic:  online version of the NYT article quoted and cited below.
 

Why are so many lumbar fusions done, in spite of the absence of evidence for their efficacy?  Well, doctors find the procedure lucrative.  Patients do not pay for it themselves, so they have little incentive to look hard at the effectiveness.  And health care providers, through licensing and government regulations, have largely insulated themselves from competition from low cost providers.


(p. C1)  In Idaho Falls, Idaho, anyone suffering from the sort of lower back pain that may conceivably be helped by the fusing of two vertebrae is quite likely to have the surgery.  It’s known as lumbar fusion, and the rate at which it is performed in Idaho Falls is almost five times the national average.  The rate in Idaho Falls is 20 times that in Bangor, Me., where lumbar fusion is less common than anywhere else.

These numbers come from the wonderful Dartmouth Atlas of Health Care.  The Dartmouth researchers adjust the numbers to take into account age, race and sex, which is another way of saying that there is no good explanation for the huge variations they find.  Doctors in the Idaho Falls area are probably just being more aggressive than doctors elsewhere.

But it’s not clear that their patients are any better off.  The evidence for lumbar fusion is incredibly mixed.  It seems to help people with certain kinds of pain, but many others recover just as well without the surgery. Of course, doctors are almost always better off if the surgery is done:  The typical hospital bill for lumbar fusion is roughly $50,000.

This is about as good an example as you can find of the health care mess.  The number of lumbar fusions performed in this country has more than tripled since the early 1990s, and Medicare now spends more than $600 million a year on the procedure.  It’s one reason your health insurance bill has gone up.


For the full commentary, see: 

DAVID LEONHARDT.  "ECONOMIX; Health Care As if Costs Didn’t Matter."  The New York Times  (Weds., June 6, 2007):  C1 & C8.


How to Protect Against Bad Drugs: “Don’t Take Them”


The FDA’s major problem is not laxity, but zealotry.  Its current get-tough view on conflict of interest only aggravates the fundamental flaw in its institutional design. Transfixed on the harms drugs can cause, the FDA remains largely oblivious to the harms they can prevent. Any delay in the use of a successful drug is costly: The delay matters little to the FDA, but a great deal to the thousands who plea for compassionate exemptions to try a drug that has not met with FDA approval.  Nor is the FDA sensitive, as individual physicians surely are, to the simple fact that a drug which cannot be tolerated by one person works wonders in another.

. . .

Right now, we all have a simple expedient to protect ourselves against dangerous drugs that make it to the market: Don’t take them. But we have no protection at all when the FDA denies us that choice in the first place. Right now the pace of drug approval is too slow.  We don’t need the FDA to slow it up still further.


For the full commentary, see: 

Richard A. Epstein.  “Drug Crazy.”  The Wall Street Journal  (Mon., March 26, 2007):  A12.

(Note:  ellipsis added.)


Congestion Pricing in NYC Will Reduce Traffic and Pollution


   Traffic congestion on Ninth Avenue in New York City.  Source of photo:  online version of the NYT article cited below.


(p. A1)  ALBANY, June 7 — Mayor Michael R. Bloomberg’s plan to reduce traffic by charging people who drive into the busiest parts of Manhattan received significant support on Thursday as Gov. Eliot Spitzer endorsed the idea and the Bush administration indicated that New York stood to gain hundreds of millions of dollars if the plan were enacted.

If the measure is approved by the Legislature, New York will become the first city in the United States to impose a broad system of congestion pricing, which was introduced in London in 2003 and has been credited with reducing traffic there.

Governor Spitzer said he would work to ensure passage of the plan, which is a major part of the mayor’s blueprint for improving air quality and traffic flow for the next several decades. The Bloomberg administration has estimated that it could put the program into effect within 18 months of legislative approval.


For the full story, see:

DANNY HAKIM and RAY RIVERA.  "New York Bid on Traffic Pricing Draws State and U.S. Support." The New York Times  (Fri., June 8, 2007): A1 & A29.

(Note: the online version of the article has the title "City Traffic Pricing Wins U.S. and Spitzer’s Favor.")


More Millionaires


The ranks of the richest Americans expanded last year at an increased pace, driven by a strong economy, but that growth is expected to moderate in coming years, according to a new study.

The 11th annual World Wealth Report, compiled by Merrill Lynch & Co. and Capgemini Group, shows that in 2006, the U.S. population of high-net-worth individuals — those with at least $1 million in investible assets, excluding their primary residences — rose 9.4% to 2.92 million. In 2005, the same population increased 6.8% to 2.67 million.

Robert McCann, president of Merrill Lynch Global Private Client Group, attributed the increased pace of wealth generation to gains in economic output and continued growth in the world’s stock markets, two primary drivers of wealth creation.


For the full story, see:

DAISY MAXEY.  "Ranks of Rich in U.S. Grow at Faster Pace."   The Wall Street Journal   (June 28, 2007):  D6. 


Searching for Schumpeter in Amazon


Econ Journal Watch, a fresh innovative online journal, just published a paper of mine where I document the large number of books included in Amazon.com’s "Search Within the Book" feature, that mention Schumpeter.  The nature of the mentions vary, but many relate to Schumpeter’s process of creative destruction.  The focus on creative destruction is especially pronounced in business books. 

The fact that many business practitioners find "creative destruction" to be a fruitful concept in understanding capitalism, speaks well of the concept, and speaks well of Schumpeter.


The citation for my paper is:

Diamond, Arthur M., Jr. "Thriving at Amazon: How Schumpeter Lives in Books Today." Econ Journal Watch 4, no. 3 (September 2007): 338-44.


My paper has been highlighted at: 

http://organizationsandmarkets.com/2007/09/10/content-analysis-using-amazoncom/

(Thanks to Kevin Rollins for alerting me to this blog entry.)


With Right Incentives, Workers Make Better Tech Purchases Than Managers


(p. A7)  Corporate technology managers usually pick laptops, software and other technology for employees. Now some tech managers are finding workers can do a better job when they choose and buy the equipment themselves.

At KLM Royal Dutch Airlines, a unit of Air France-KLM SA, employees had expressed frustration at the company’s policy of providing and supporting only one type of laptop, the Lenovo A30 (formerly IBM), and one smartphone, the Nokia 6021. Last November, Martien van Deth, a senior technology officer in the Amsterdam office, tried a new system: He gave 50 information-technology staffers an allowance of $203, covering two years, to buy cellphones for corporate use. Those who picked more expensive phones paid the extra. Those who chose cheaper phones kept the change. As long as the phone ran Microsoft Corp.’s Windows Mobile version 5 or 6 operating system, KLM guaranteed access to corporate email. The catch: Users had to deal with technical problems themselves and replace phones that broke.

Not only did the program cost less than the $231 the company paid (p. A9) for phones and support over the same period, it was a hit with employees — some of whom bought phones with fancy ringtones and video players. Now "no one can complain that their corporate phone doesn’t have a camera," says Mr. van Deth, who plans to offer a tech allowance to KLM’s entire 1,000-person IT department later this summer, and wants to take the program companywide. He’s also about to start a tech-allowance program for laptops.


For the full story, see: 

BEN WORTHEN.  "Office Tech’s Next Step:  Do It Yourself."  The Wall Street Journal  (Tues., July 3, 2007):  A7 & A9.


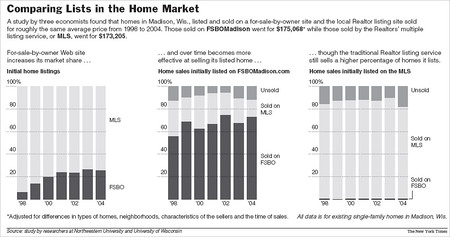
For-Sale-By-Owner Web Site Beats Real Estate Agents


Source of graphic:  online version of the NYT article cited below.


(p. A1)  It sounds like the setup for a dull economist’s joke. Who gets the better deal: the cautious economist who sells his house through a real estate agent, or his risk-taking colleague who finds a buyer on his own?

But the question — debated by two Northwestern University economists who chose different methods to sell their homes — and the research it helped prompt are serious. And the answer will be of interest to anyone who has paused to consider whether paying a real estate agent’s commission, typically 5 to 6 percent of the sale price, is worth it.

The conclusion, in a study to be released today based on home-sales data from 1998 to 2004 in Madison, Wis., is that people in that city who sold their homes through real estate agents typically did not get a higher sale price than people who sold their homes themselves. When the agent’s commission is factored in, the for-sale-by-owner people came out ahead financially.


For the full story, see:

JEFF BAILEY.  "One City’s Home Sellers Do Better on Their Own."  The New York Times  (Fri., June 8, 2007):  A1 & C7. 


Economist Handel (left) sold his home by himself, while economist Nevo (right) used a real estate agent.  Source of photo:  online version of the NYT article cited above.


London Mayor: Congestion-Pricing Works


In 2003, London put in place a £5 (about $9) a day congestion charge for all cars that entered the center city (the charge is now £8). This led to an immediate drop of 70,000 cars a day in the affected zone. Traffic congestion fell by almost 20 percent. Emissions of the greenhouse gas carbon dioxide were cut by more than 15 percent.

The negative side effects predicted by opponents never materialized. The retail sector in the zone has seen increases in sales that have significantly exceeded the national average. London’s theater district, which largely falls within the zone, has been enjoying record audiences. People are still flocking to London — they’re simply doing so in more efficient and less polluting ways.

. . .

Is London’s success a guarantee that congestion charging will work in New York? Of course not. But it is an indicator that properly executed congestion pricing works, and works well. Singapore and Stockholm already operate such programs and other cities are examining them. Given the success of congestion charging in London, this is not surprising.


For the full commentary, see: 

KEN LIVINGSTONE.  "OP-ED CONTRIBUTOR; Clear Up the Congestion-Pricing Gridlock."  The New York Times   (Mon., July 2, 2007):  A21.


When You Need to Know the Difference Between Glacier Creek and Big Thompson River


  Is it Glacier Creek, or Big Thompson River?  Source of photo:  me. 


On May 17, 2007, in Estes Park, Colorado, I was the co-leader of a "two hour" hike with 15 Montessori middle-schoolers from Omaha, Nebraska.  At some point what we were seeing didn’t seem to correspond with what our roughly drawn YMCA map told us we should be seeing–we worried that we had taken a wrong turn and were lost.

II we were on course, then the water beside us should be Glacier Creek.  If we were lost, then it was probably Big Thompson River.  (It’s appearance didn’t help–it looked a bit larger than a creek, but a lot smaller than a ‘big river.’)

The first person I found to ask was a tourist who admitted upfront that she was extremely uncertain about where we were.  She pulled out a modest map, and pointed to where she thought we might be, which was along the Big Thompson River.

Seeking confirmation, I apologetically interrupted a fellow teaching his girl-friend how to fly fish.  This fellow was dressed as an outdoors-man, and exuded confidence.  He talked about hiking on a glacier the day before.  He helpfully strode back to his SUV with me and pulled a detailed, authoritative-looking map.  With no doubt, he pointed on the map to where we were, on Glacier Creek, as I had hoped.  As we walked back to where he had been fishing, he pointed in the direction that we had been hiking, and said that without question, we should continue to hike in that direction.

The scenery was fantastic, but Cindy began to worry whether we were going in the right direction, pointing out that there didn’t seem to be any opening in the mountains in the direction in which we were supposing the YMCA camp should be.  I agreed with her observation, but said that there must be some non-obvious route, because the fellow who pointed us in this direction had exuded credibility.

We finally got to a small museum.  There, an old park service employee asked where we were from.  When I said "Omaha" he jokingly asked if knew his old friend Warren Buffet?  He told us that he had lived in this area all his life, and that we were definitely walking along Big Thompson River.  Then he tried to draw a map to show us how to get back.  He scratched his head, discarded his first attempt, and started trying again.  Then he asked us (again) where we were from?  At this point, I was really worried.

But his second attempt at a map was a good one–it got us back to the YMCA camp.

Maybe we should look for advice from those who are self-critical, as the old man was, rather than from those who exude undoubting self-confidence, as the fly fisherman did?  (Or maybe the key was local credentials?)

Maybe, I made a mistake that Christensen and Raynor warn against in their The Innovator’s Solution:  looking at charisma and confidence as signs of who to follow.  (In fairness to myself, at the time, I didn’t have much else to go on.)


Majority of iPod Value-Added is from the United States


Who makes the Apple iPod? Here’s a hint: It is not Apple. The company outsources the entire manufacture of the device to a number of Asian enterprises, among them Asustek, Inventec Appliances and Foxconn.

But this list of companies isn’t a satisfactory answer either: They only do final assembly. What about the 451 parts that go into the iPod? Where are they made and by whom?


Three researchers at the University of California, Irvine — Greg Linden, Kenneth L. Kraemer and Jason Dedrick — applied some investigative cost accounting to this question, using a report from Portelligent Inc. that examined all the parts that went into the iPod.

. . .

Continuing in this way, the researchers examined the major components of the iPod and tried to calculate the value added at different stages of the production process and then assigned that value added to the country where the value was created. This isn’t an easy task, but even based on their initial examination, it is quite clear that the largest share of the value added in the iPod goes to enterprises in the United States, particularly for units sold here.

The researchers estimated that $163 of the iPod’s $299 retail value in the United States was captured by American companies and workers, breaking it down to $75 for distribution and retail costs, $80 to Apple, and $8 to various domestic component makers. Japan contributed about $26 to the value added (mostly via the Toshiba disk drive), while Korea contributed less than $1.

. . .

The real value of the iPod doesn’t lie in its parts or even in putting those parts together. The bulk of the iPod’s value is in the conception and design of the iPod. That is why Apple gets $80 for each of these video iPods it sells, which is by far the largest piece of value added in the entire supply chain.

Those clever folks at Apple figured out how to combine 451 mostly generic parts into a valuable product. They may not make the iPod, but they created it. In the end, that’s what really matters.


For the full commentary, see: 

VARIAN, HAL R.  "ECONOMIC SCENE; An iPod Has Global Value. Ask the (Many) Countries That Make It."  The New York Times  (Thurs.,  June 28, 2007):  C3.


The working paper that is the main source for Varian’s commentary, is: 

Linden, Greg, Kenneth Kraemer, and Jason Dedrick. "Who Captures Value in a Global Innovation System? The Case of Apple’s Ipod." UC Irvine, June 2007.

The link is:   http://pcic.merage.uci.edu/papers/2007/AppleiPod.pdf