Majority of Marine Creatures Thrive in Greater Acidity

(p. C4) The effect of acidification, according to J.E.N. Veron, an Australian coral scientist, will be “nothing less than catastrophic…. What were once thriving coral gardens that supported the greatest biodiversity of the marine realm will become red-black bacterial slime, and they will stay that way.”
This is a common view. The Natural Resources Defense Council has called ocean acidification “the scariest environmental problem you’ve never heard of.” Sigourney Weaver, who narrated a film about the issue, said that “the scientists are freaked out.” The head of the National Oceanic and Atmospheric Administration calls it global warming’s “equally evil twin.”
. . .
If the average pH of the ocean drops to 7.8 from 8.1 by 2100 as predicted, it will still be well above seven, the neutral point where alkalinity becomes acidity.
. . .
In a recent experiment in the Mediterranean, reported in Nature Climate Change, corals and mollusks were transplanted to lower pH sites, where they proved “able to calcify and grow at even faster than normal rates when exposed to the high [carbon-dioxide] levels projected for the next 300 years.” In any case, freshwater mussels thrive in Scottish rivers, where the pH is as low as five.
Laboratory experiments find that more marine creatures thrive than suffer when carbon dioxide lowers the pH level to 7.8. This is because the carbon dioxide dissolves mainly as bicarbonate, which many calcifiers use as raw material for carbonate.

For the full commentary, see:
MATT RIDLEY. “MIND & MATTER; Taking Fears of Acid Oceans With a Grain of Salt.” The Wall Street Journal (Sat., January 7, 2012): C4.
(Note: ellipsis in first paragraph in original; ellipses between paragraphs added.)

Amateurs Can Advance Science

(p. C4) The more specialized and sophisticated scientific research becomes, the farther it recedes from everyday experience. The clergymen-amateurs who made 19th-century scientific breakthroughs are a distant memory. Or are they? Paradoxically, in an increasing variety of fields, computers are coming to the rescue of the amateur, through crowd-sourced science.
Last month, computer gamers working from home redesigned an enzyme. Last year, a gene-testing company used its customers to find mutations that increase or decrease the risk of Parkinson’s disease. Astronomers are drawing amateurs into searching for galaxies and signs of extraterrestrial intelligence. The modern equivalent of the Victorian scientific vicar is an ordinary person who volunteers his or her time to solving a small piece of a big scientific puzzle.
Crowd-sourced science is not a recent invention. In the U.S., tens of thousands of people record the number and species of birds that they see during the Christmas season, a practice that dates back more than a century. What’s new is having amateurs contribute in highly technical areas.

For the full commentary, see:
MATT RIDLEY. “MIND & MATTER; Following the Crowd to Citizen Science.” The Wall Street Journal (Sat., FEBRUARY 11, 2012): C4.

Big Data Opportunity for Economics and Business

(p. 7) Data is not only becoming more available but also more understandable to computers. Most of the Big Data surge is data in the wild — unruly stuff like words, images and video on the Web and those streams of sensor data. It is called unstructured data and is not typically grist for traditional databases.
But the computer tools for gleaning knowledge and insights from the Internet era’s vast trove of unstructured data are fast gaining ground. At the forefront are the rapidly advancing techniques of artificial intelligence like natural-language processing, pattern recognition and machine learning.
Those artificial-intelligence technologies can be applied in many fields. For example, Google’s search and ad business and its experimental robot cars, which have navigated thousands of miles of California roads, both use a bundle of artificial-intelligence tricks. Both are daunting Big Data challenges, parsing vast quantities of data and making decisions instantaneously.
. . .
To grasp the potential impact of Big Data, look to the microscope, says Erik Brynjolfsson, an economist at Massachusetts Institute of Technology’s Sloan School of Management. The microscope, invented four centuries ago, allowed people to see and measure things as never before — at the cellular level. It was a revolution in measurement.
Data measurement, Professor Brynjolfsson explains, is the modern equivalent of the microscope. Google searches, Facebook posts and Twitter messages, for example, make it possible to measure behavior and sentiment in fine detail and as it happens.
In business, economics and other fields, Professor Brynjolfsson says, decisions will increasingly be based on data and analysis rather than on experience and intuition. “We can start being a lot more scientific,” he observes.
. . .
Research by Professor Brynjolfsson and two other colleagues, published last year, suggests that data-guided management is spreading across corporate America and starting to pay off. They studied 179 large companies and found that those adopting “data-driven decision making” achieved productivity gains that were 5 percent to 6 percent higher than other factors could explain.
The predictive power of Big Data is being explored — and shows promise — in fields like public health, economic development and economic forecasting. Researchers have found a spike in Google search requests for terms like “flu symptoms” and “flu treatments” a couple of weeks before there is an increase in flu patients coming to hospital emergency rooms in a region (and emergency room reports usually lag behind visits by two weeks or so).
. . .
In economic forecasting, research has shown that trends in increasing or decreasing volumes of housing-related search queries in Google are a more accurate predictor of house sales in the next quarter than the forecasts of real estate economists. The Federal Reserve, among others, has taken notice. In July, the National Bureau of Economic Research is holding a workshop on “Opportunities in Big Data” and its implications for the economics profession.

For the full story, see:

STEVE LOHR. “NEWS ANALYSIS; The Age of Big Data.” The New York Times, SundayReview (Sun., February 12, 2012): 1 & 7.

(Note: ellipses added.)
(Note: the online version of the article is dated February 11, 2012.)

Stem Cell Therapy for Dry Macular Degeneration

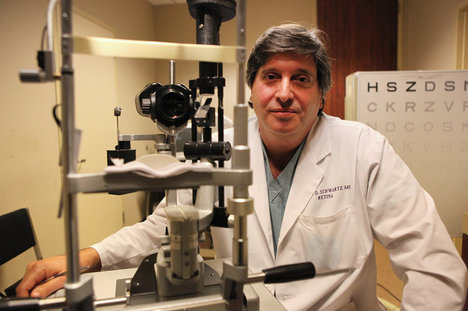
SchwartzStevenRetinaSpecialist2012-01-30.jpg

“Dr. Steven Schwartz, a retina specialist at the University of California, Los Angeles, conducted the trial with two patients.” Source of caption and photo: online version of the NYT article quoted and cited below.

(p. B7) LOS ANGELES — A treatment for eye diseases that is derived from human embryonic stem cells might have improved the vision of two patients, bolstering the beleaguered field, researchers reported Monday.
The report, published online in the medical journal The Lancet, is the first to describe the effect on patients of a therapy involving human embryonic stem cells.
. . ..
Both patients, who were legally blind, said in interviews that they had gains in eyesight that were meaningful for them. One said she could see colors better and was able to thread a needle and sew on a button for the first time in years. The other said she was able to navigate a shopping mall by herself.
. . .
. . . , researchers at Advanced Cell Technology turned embryonic stem cells into retinal pigment epithelial cells. Deterioration of these retinal cells can lead to damage to the macula, the central part of the retina, and to loss of the straight-ahead vision necessary to recognize faces, watch television or read.
Some 50,000 of the cells were implanted last July under the retinas in one eye of each woman in operations that took about 30 minutes.
One woman, Sue Freeman, who is in her 70s, suffered from the dry form of age-related macular degeneration, a leading cause of severe vision loss in the elderly.

For the full story, see:
ANDREW POLLACK. “Stem Cell Treatment for Eye Diseases Shows Promise.” The New York Times (Thurs., January 26, 2012): B7.
(Note: ellipses added.)
(Note: the online version of the article was dated January 25, 2012.)

FreemanSueVisionImproved2012-01-30.jpg

“Sue Freeman said her vision improved in a meaningful way after the treatment, which used embryonic stem cells.” Source of caption and photo: online version of the NYT article quoted and cited above.

“Just What Ailments Are Pylos Tablets Supposed to Alleviate?”

LinearBscript2012-01-14.jpg

“Professor Bennett’s work opened a window to deciphering tablets written in Linear B, a Bronze Age Aegean script.” Source of caption and photo: online version of the NYT obituary quoted and cited below.

(p. 22) Deciphering an ancient script is like cracking a secret code from the past, and the unraveling of Linear B is widely considered one of the most challenging archaeological decipherments of all time, if not the most challenging.
. . .
Linear B recorded the administrative workings of Mycenaean palatial centers on Crete and the Greek mainland 3,000 years ago: accounts of crops harvested, flocks tended, goods manufactured (including furniture, chariots and perfume), preparations for religious feasts and preparations for war.
It was deciphered at last in 1952, not by a scholar but by an obsessed amateur, a young English architect named Michael Ventris. The decipherment made him world famous before his death in an automobile accident in 1956.
As Mr. Ventris had acknowledged, he was deeply guided by Professor Bennett’s work, which helped impose much-needed order on the roiling mass of strange, ancient symbols.
In his seminal monograph “The Pylos Tablets” (1951), Professor Bennett published the first definitive list of the signs of Linear B. Compiling such a list is the essential first step in deciphering any unknown script, and it is no mean feat.
. . .
“We know how much Ventris admired Bennett, because he immediately adopted Bennett’s sign list of Linear B for his own work before the decipherment,” said Mr. Robinson, whose book “The Man Who Deciphered Linear B” (2002) is a biography of Mr. Ventris. “He openly said, ‘This is a wonderful piece of work.’ ”
. . .
As meticulous as Professor Bennett’s work was, it once engendered great confusion. In 1951, after he sent Mr. Ventris a copy of his monograph, a grateful Ventris went to the post office to pick it up. As Mr. Robinson’s biography recounts, a suspicious official, eyeing the package, asked him: “I see the contents are listed as Pylos Tablets. Now, just what ailments are pylos tablets supposed to alleviate?”

For the full obituary, see:
MARGALIT FOX. “Emmett L. Bennett Jr., Ancient Script Expert, Dies at 93.” The New York Times, First Section (Sun., January 1, 2012,): 22.
(Note: ellipses added.)
(Note: the online version of the obituary is dated December 31, 2011, and has the title: “Emmett L. Bennett Jr., Expert on Ancient Script, Dies at 93.”)

The book on the amateur, uncredentialed Ventris is:
Robinson, Andrew. The Man Who Deciphered Linear B: The Story of Michael Ventris. London, UK: Thames & Hudson, 2002.

BennettEmmettJr2012-01-14.jpg

“Emmett L. Bennett Jr.” Source of caption and photo: online version of the NYT obituary quoted and cited above.

When a Graph Is a Matter of Life and Death

(p. 72) In her authoritative book The Challenger Launch Decision, sociologist Diane Vaughan demolishes the myth that NASA managers ignored unassailable data and launched a mission absolutely known to be unsafe. In fact, the conversations on the evening before launch reflected the confusion and shifting views of the participants. At one point, a NASA manager blurted, “My God, Thiokol, when do you want me to launch, next April?” But at another point on the same evening, NASA managers expressed reservations about the launch; a lead NASA engineer pleaded with his people not to let him make a mistake and stated, “I will not agree to launch against the contractor’s recommendation.” The deliberations lasted for nearly three hours. If the data had been clear, would they have needed a three-hour discussion? Data analyst extraordinaire Edward Tufte shows in his book Visual Explanations that if the engineers had plotted the data points in a compelling graphic, they might have seen a clear trend line: every launch below 66 degrees showed evidence of (p. 73) O-ring damage. But no one laid out the data in a clear and convincing visual manner, and the trend toward increased danger in colder temperatures remained obscured throughout the late-night teleconference debate. Summing up, the O-Ring Task Force chair noted, “We just didn’t have enough conclusive data to convince anyone.”

Source:
Collins, Jim. How the Mighty Fall: And Why Some Companies Never Give In. New York: HarperCollins Publishers, Inc., 2009.
(Note: italics in original.)

Science Not Accurate at Predicting Storm Intensity

(p. D1) For scientists who specialize in hurricanes, Irene, which roared up the Eastern Seaboard over the weekend, has shone an uncomfortable light on their profession. They acknowledge that while they have become adept at gauging the track a hurricane will take, their predictions of a storm’s intensity leave much to be desired.

Officials with NOAA’s National Hurricane Center had accurately forecast that Irene would hit North Carolina, and then churn up the mid-Atlantic coast into New York. But they thought the storm would be more powerful, its winds increasing in intensity after it passed through the Bahamas on Thursday.
Instead, the storm lost strength. By the time it made landfall in North Carolina two days later, its winds were about 10 percent lighter than predicted.
It’s not a new problem. “With intensity, we just haven’t moved off square zero,” Dr. Marks said. Forecasting a storm’s strength requires knowing the fine details of its structure — the internal organization and movement that can affect whether it gains energy or loses it — and then plugging those details into an accurate computer model.
Scientists have struggled to do that. They often overestimate strength, which can lead to griping about overpreparedness, as it has with Irene. But they have sometimes underestimated a storm’s power, too, as with (p. D3) Hurricane Charley in 2004. And it is far worse to be underprepared for a major storm.

For the full story, see:
HENRY FOUNTAIN. “Intensity of Hurricanes Still Bedevils Scientists.” The New York Times (Tues., August 30, 2011): D1 & D3.
(Note: the online version of the article is dated August 29, 2011.)

Global Temperatures May Have Flattened, Justifying Global Warming Scepticism

TucumcariWeatherStation2011-11-10.jpgTucsonParkingLotWeatherStation2011-11-10.jpg“Well-sited weather stations, like the one at top in Tucumcari, N.M., are more reliable than others, such as one in a Tuscon, Ariz., parking lot.” Source of caption: print version of the WSJ article quoted and cited below. Source of photos: online version of the WSJ article quoted and cited below.

(p. A2) “Before us, there was a huge barrier to entry” in the field of analyzing temperature numbers, says Richard Muller, scientific director of the Berkeley Earth Surface Temperature team and a physicist at the University of California, Berkeley.

Many scientists are giving the Berkeley Earth team kudos for creating the unified database.
. . .
“I’m inclined to give [satellite] data more weight than reconstructions from surface-station data,” says Stephen McIntyre, a Canadian mathematician who writes about climate, often critically of studies that find warming, at his website Climate Audit. Satellites show about half the amount of warming as that of land-based readings in the past three decades, when the relevant data were collected from space, he says.
Such disputes demonstrate the statistical and uncertain nature of tracking global temperature. Even with tens of thousands of weather stations, most of the Earth’s surface isn’t monitored. Some stations are more reliable than others. Calculating a global average temperature requires extrapolating from these readings to the whole globe, adjusting for data lapses and suspect stations. And no two groups do this identically.
. . .
Calculating a global temperature is necessary to track climate trends because, as your TV meteorologist might warn, local conditions can differ. Much of the U.S. and Northern Europe has cooled in the last 70 years, Berkeley Earth found. So did one-third of all weather stations world-wide, while two-thirds warmed. The project cites this as evidence of overall warming; skeptics aren’t convinced because it depends how concentrated those warming sites are. If they happen to be bunched up while the cooling sites are in sparsely measured areas, then more places could be cooling.
. . .
Any statistical model produces results with some level of uncertainty. The Berkeley Earth project is no different. That uncertainty is large enough to dwarf some trends in temperature. For instance, fluctuations in the land temperature for the past 13 years make it extremely difficult to say whether the Earth has been continuing to warm during that time.
This possible halting of the temperature rise led to a dispute between members of the Berkeley Earth team. Judith Curry, Mr. Muller’s co-author and a professor of earth and atmospheric sciences at the Georgia Institute of Technology, told a reporter for the Daily Mail she questioned Mr. Muller’s claim, which he published in an opinion column in The Wall Street Journal, that “you should not be a skeptic, at least not any longer.” She said that if the global temperature has flattened out, that would raise new questions, and scientific skepticism would remain warranted.

For the full story, see:
CARL BIALIK. “THE NUMBERS GUY; Global Temperatures: All Over the Map.” The Wall Street Journal (Sat., November 5, 2011): A2.
(Note: ellipses added.)

Crows Use Tools Too

NewCaledonianCrowStickTool2011-11-09.jpg

“A captive New Caledonian crow forages for food using a stick tool.” Source of caption and photo: online version of the NYT article quoted and cited below.

(p. D3) New Caledonian crows, found in the South Pacific, are among nature’s most robust nonhuman tool users. They are well known for using twigs to dislodge beetle larvae from tree trunks.

And there’s a good reason. By foraging for just a few larvae, a crow can satisfy its daily nutritional needs, which explains the evolutionary advantage of learning how to use tools, researchers report in the journal Science.

For the full story, see:
SINDYA N. BHANOO. “OBSERVATORY; Crows Put Tools to Use to Access a Nutritious Diet.” The New York Times (Tues., September 21, 2010): D3.
(Note: the online version of the article is dated September 20, 2010.)

Huge Variance in Estimates of Number of Species

(p. D3) Scientists have named and cataloged 1.3 million species. How many more species there are left to discover is a question that has hovered like a cloud over the heads of taxonomists for two centuries.
“It’s astounding that we don’t know the most basic thing about life,” said Boris Worm, a marine biologist at Dalhousie University in Nova Scotia.
On Tuesday, Dr. Worm, Dr. Mora and their colleagues presented the latest estimate of how many species there are, based on a new method they have developed. They estimate there are 8.7 million species on the planet, plus or minus 1.3 million.
. . .
In recent decades, scientists have looked for better ways to determine how many species are left to find. In 1988, Robert May, an evolutionary biologist at the University of Oxford, observed that the diversity of land animals increases as they get smaller. He reasoned that we probably have found most of the species of big animals, like mammals and birds, so he used their diversity to calculate the diversity of smaller animals. He ended up with an estimate 10 to 50 million species of land animals.
Other estimates have ranged from as few as 3 million to as many as 100 million. Dr. Mora and his colleagues believed that all of these estimates were flawed in one way or another. Most seriously, there was no way to validate the methods used, to be sure they were reliable.

For the full story, see:
CARL ZIMMER. “How Many Species? A Study Says 8.7 Million, but It’s Tricky.” The New York Times (Tues., August 30, 2011): D3.
(Note: ellipsis added.)
(Note: the online version of the article is dated August 23 (sic), 2011.)

Fossil Shows Placental Mammals 35 Million Years Earlier

PlacentalMammalFossilEarliest2011-11-07.jpg

“The earliest known eutherian from the Jurassic of China.” Source of caption and photo: online version of the NYT article quoted and cited below.

(p. D3) The split between placental mammals and marsupials may have occurred 35 million years earlier than previously thought, according to a new study.
. . .
The newly identified mammal was small, weighing less than a chipmunk. Based on its claws, it appears to have been an active climber. “This was a skinny little animal, eating insects,” said Dr. Luo. “We imagine it was active in the night and capable of going up and down trees.”
Its discovery helps reconcile fossil evidence and molecular analysis. Modern molecular studies, which use DNA to estimate dates of evolution, also put the emergence of placentals at about 160 million years ago.

For the full story, see:
SINDYA N. BHANOO. “OBSERVATORY; A Small Mammal Fossil Tells a Jurassic Tale.” The New York Times (Tues., August 30, 2011): D3.
(Note: ellipsis added.)
(Note: the online version of the article is dated August 24 (sic), 2011.)